Running and debugging flows
Execute flows with Process Flow, inspect node consoles and history, trigger flows from outside, and monitor them in Analytics.
Run from the editor
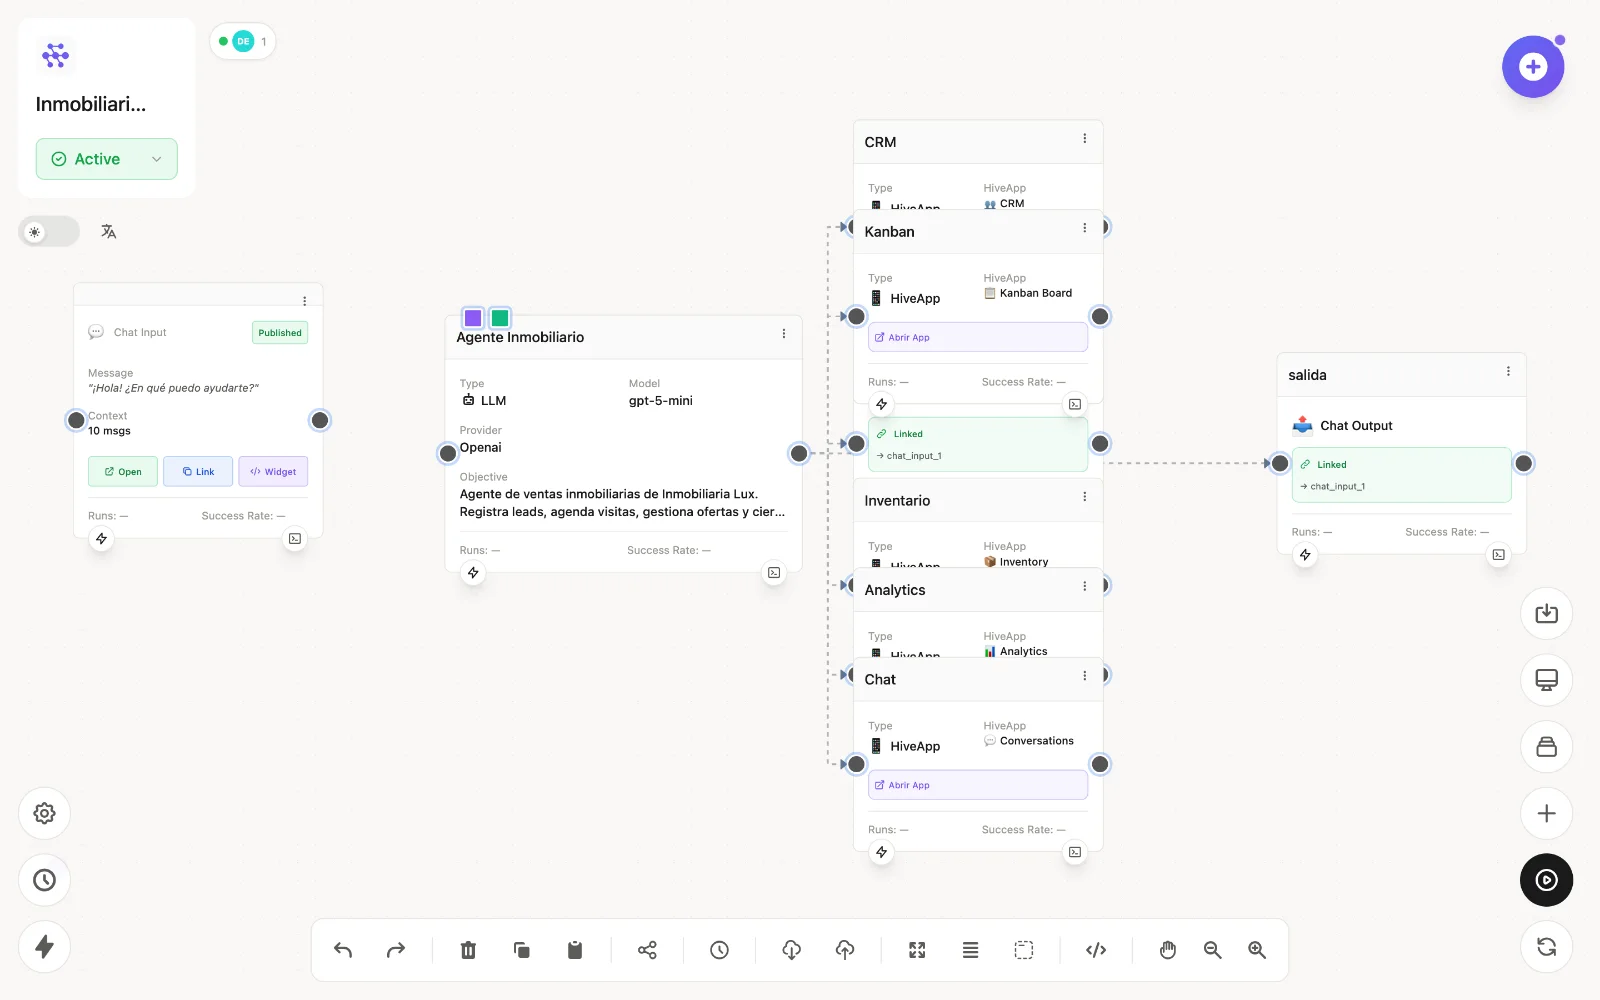
Process Flow (▶ in the editor) executes the whole flow with the current inputs. Nodes light up as they run and show per-node Runs and Success Rate counters. Reset States clears execution state so you can run clean again.
Debug with the node Console
Every node has a Console (terminal icon) with its latest execution: input received, output produced, timing, errors, and — for LLM nodes with tools — the Function Calling Process tab showing each round: what the model decided, which tools ran, their results and the final response. It's the single most useful debugging surface in HiveFlow.
The editor also keeps a process history (clock icon) with previous executions of the whole flow.
Ways to trigger a flow
| Channel | How |
|---|---|
| Editor | Process Flow button — manual runs while building. |
| Chat / Form | Public interfaces from chat_input / form_input nodes (link or embeddable widget). |
| HTTP Trigger | The trigger node exposes a webhook URL with an API key — call it from any system. See API. |
whatsapp_input nodes respond to messages of a connected number. | |
| Extension | extension_input receives selections/pages from the Chrome extension. |
| Agents & Apps | Agents and Hive Apps execute their linked flow on every interaction. |
| Genius | Ask it: "run my report flow". |
Handling failures
Wrap risky branches with the Error Handler node to catch failures without stopping the flow, add Human in the Loop nodes for manual approval steps, and use Wait/Loop for pacing and batching. Failed executions are visible in the node consoles and in Analytics.
Monitoring
The Analytics section aggregates executions, success rates and credit usage across flows, so you can spot failing or expensive automations at a glance.