Chart node
Renders flow data as line, bar, area, pie, scatter or radar charts — a live, shareable visualization fed by any upstream node.
Chart (chart) turns arrays into charts: pick the type, map the fields, and get a live view you can open or share publicly (/public/viz/…).
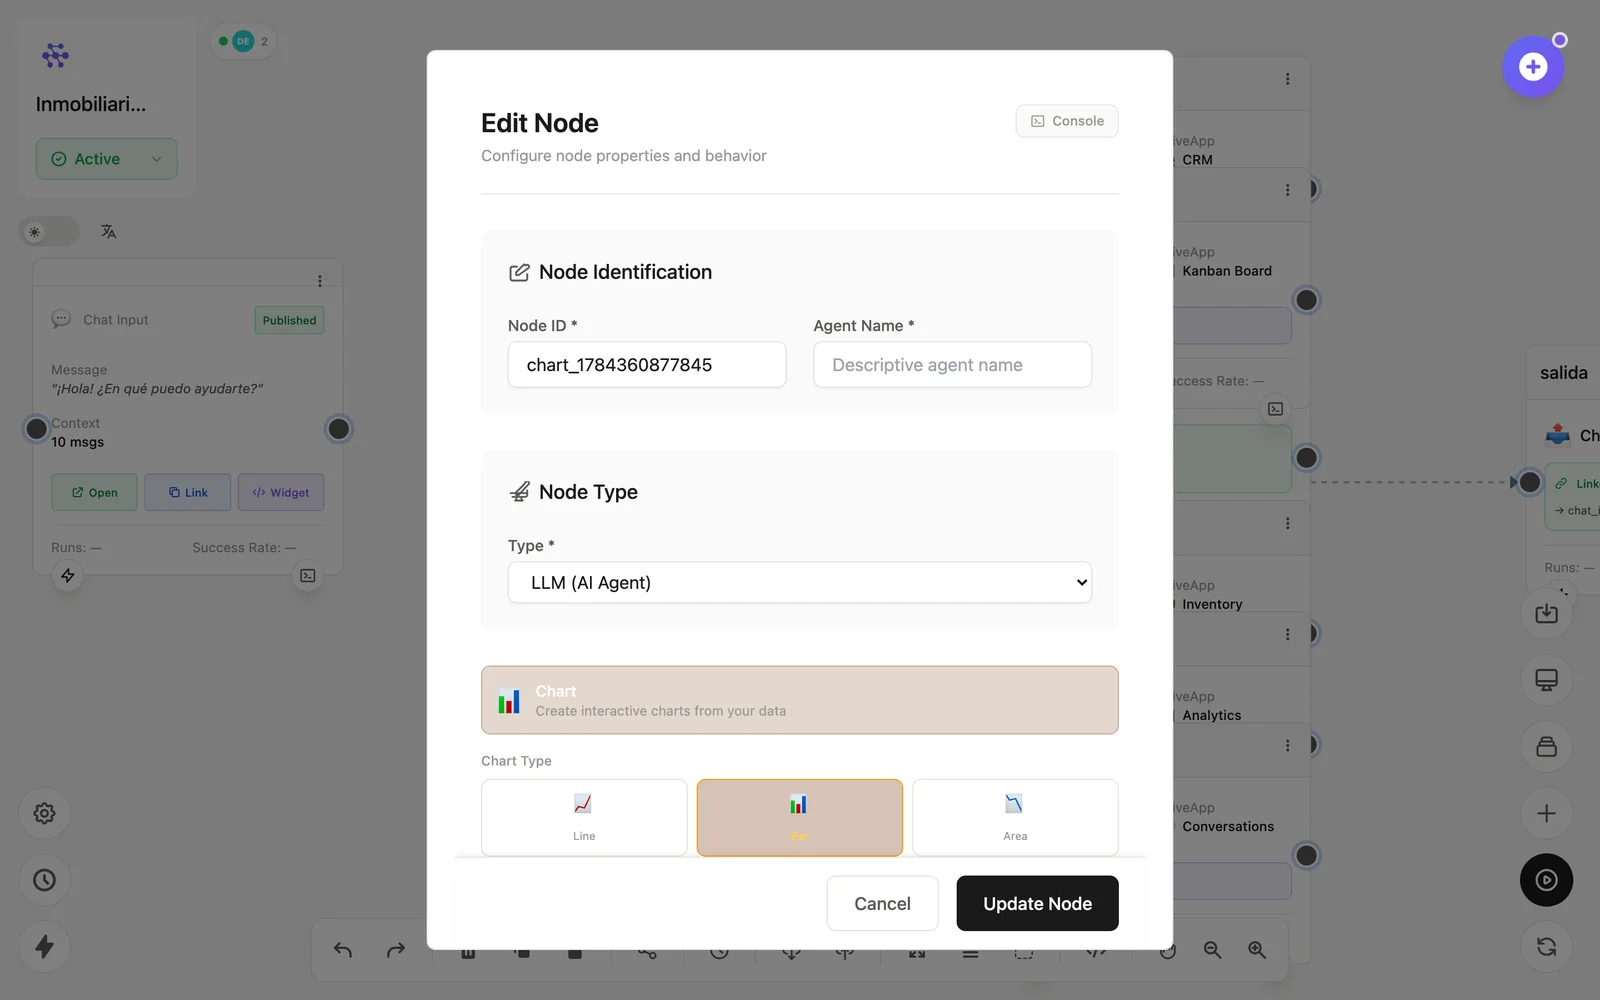
Configuration
Open the node (double-click) to edit it. Key fields:
- Node ID / Name — the identifier used in variables and the display name on the canvas.
- Chart type — line, bar, area, pie, scatter, radar.
- Data mapping — which fields feed axes/series.
Inputs & outputs
It receives arrays of records and emits/renders the chart view. Downstream nodes reference its output with {{node_id.field}} — see the variables reference.
Example
Database → Pandas (ventas por mes) → Chart (barras)See also: Visual nodes · Analytics