Analytics
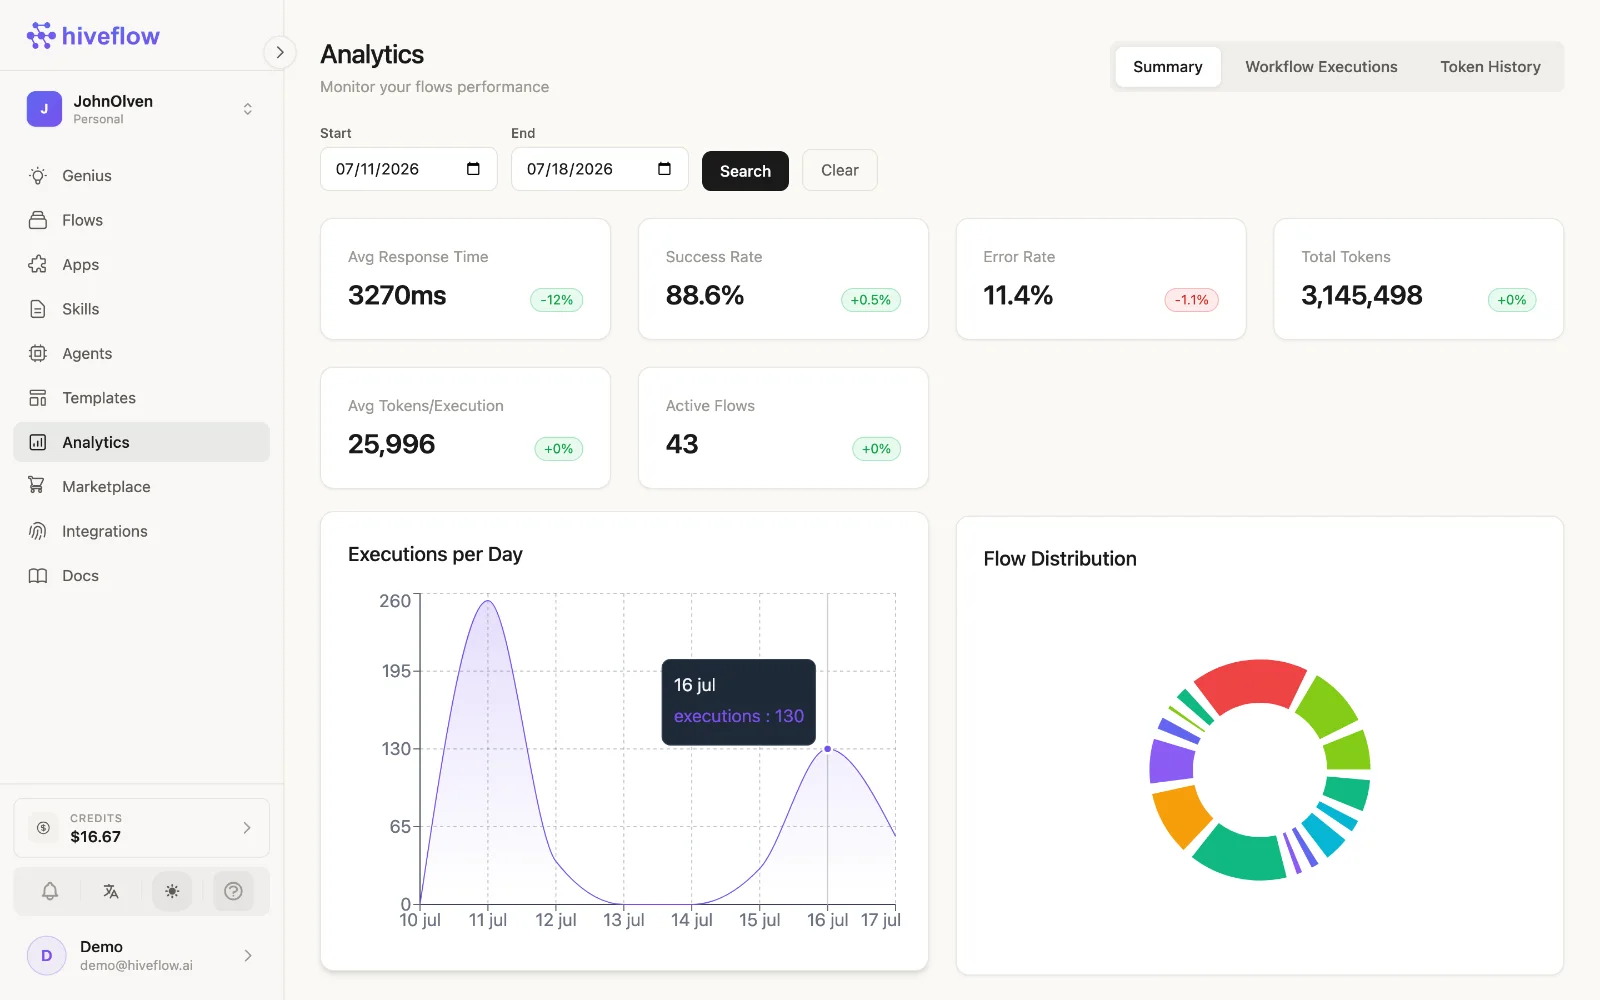
Read HiveFlow's metrics: executions per flow, success rates, credit spend and trends — and find failing or expensive automations fast.
The Analytics section aggregates what all your automations are doing: how much they run, how often they succeed, and what they cost. It's the place to look before your users tell you something broke.
What you'll find
- Executions — run volume over time, per flow, across every channel (editor, chat, WhatsApp, API, apps).
- Success rate — completed vs failed executions; a dropping rate is your earliest incident signal.
- Credit consumption — where the money goes: which flows and agents burn the most credits, and the trend.
- Per-flow breakdowns — sort by cost or failures to find the outliers.
Reading it like an operator
- Watch success rate first. Volume changes are business; failure changes are incidents.
- Chase the expensive flows. A prompt tweak or a smaller model on one hot flow often cuts spend more than anything else. The LLM node lets you swap models per node.
- Correlate with changes. Cost or failure spikes usually date to a flow edit — the editor's Versions history tells you what changed and lets you roll back.
From metric to root cause
Analytics tells you which flow misbehaves; the canvas tells you why:
- Each node shows Runs / Success Rate counters on its card.
- The node Console has the exact inputs, outputs and errors of recent executions — including the Function Calling Process for agent tool calls.
- The editor's process history (clock icon) lists past whole-flow executions.
Who can see it
In organizations, Analytics requires the view_analytics permission — so you can give finance and ops visibility without edit rights.